
San Jose Sharks
What Are Sharks Doing Better? But Why Do They Keep Losing? (+)
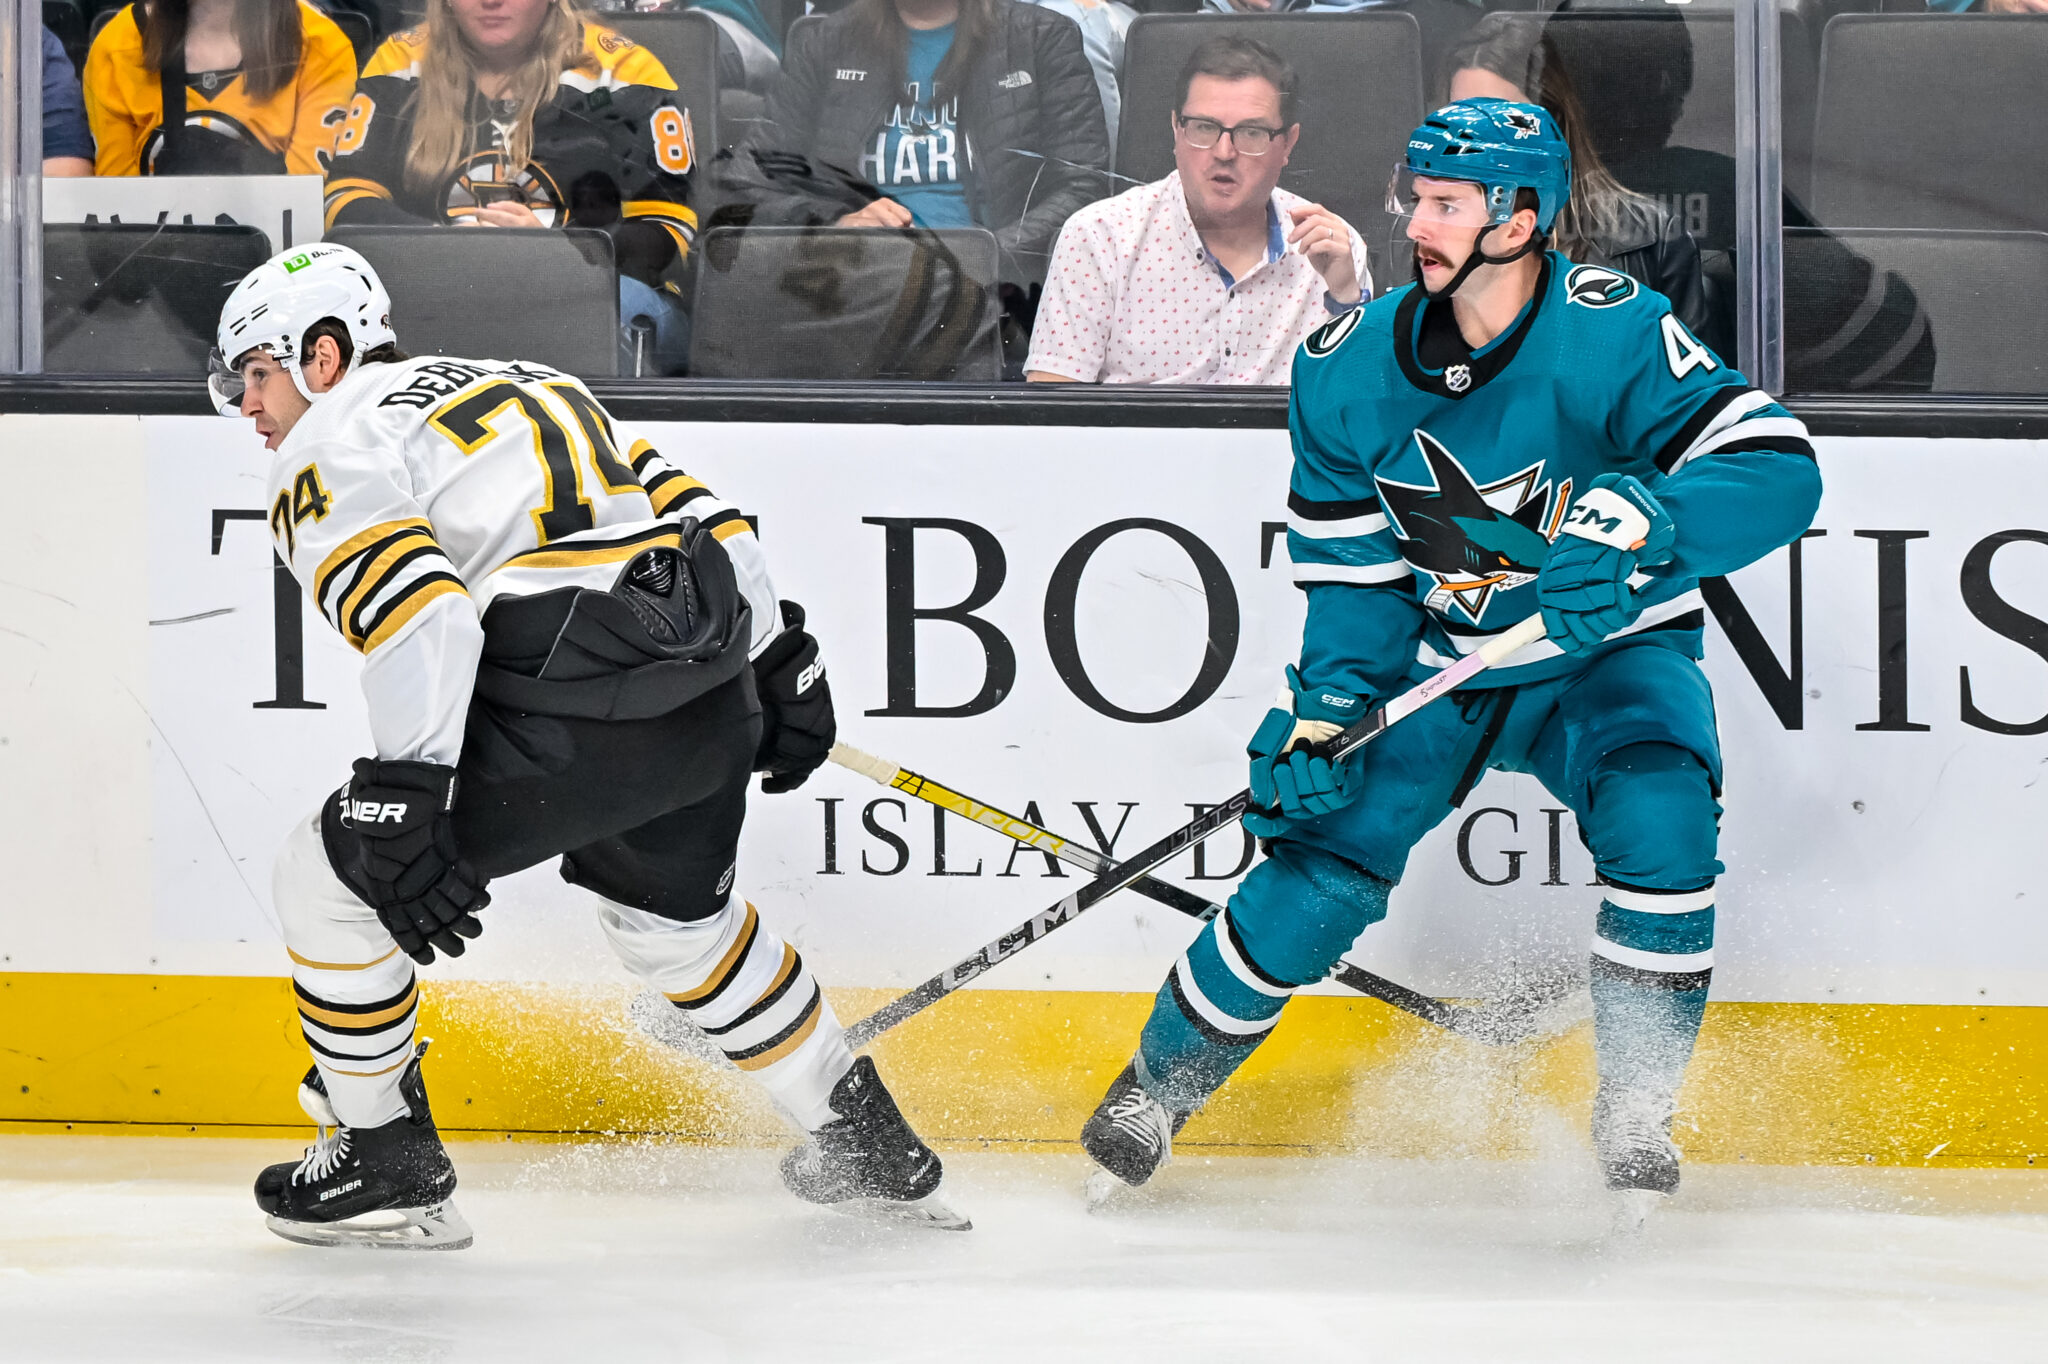
NASHVILLE — “I thought we made a step forward with the things that we touched on after our last game.”
That was head coach David Quinn’s assessment of the San Jose Sharks’ 3-1 loss to the Boston Bruins last night. And there was progress – but considering where the Sharks were coming from, a 6-3 rout at the hands of the Carolina Hurricanes on Tuesday, it was, to some degree, faint praise.
Sharks Locker Room: Quinn Praises Labanc, Suggests Granlund Return Close
But it was a step in the right direction, even though the defeat dropped San Jose to 0-3-1.
The micro-stats, per SPORTLOGiQ, underscore the Sharks’ improvements from one night to another:
| San Jose Sharks | Stats (All Situations) | Carolina Hurricanes |
|---|---|---|
| 3 | Goals | 6 |
| 16 | Shots | 42 |
| 3:25 | OZ Possession Time | 12:25 |
| 8 | High Danger Scoring Chances | 25 |
| 2 | Odd-Man Rushes | 8 |
| 36.4 | Controlled Entry Success Rate | 73.8 |
| 37.1 | Puck Battle Win Percentage | 62.9 |
| San Jose Sharks | Stats (All Situations) | Boston Bruins |
|---|---|---|
| 1 | Goals | 3 |
| 27 | Shots | 36 |
| 6:19 | OZ Possession Time | 5:43 |
| 14 | High Danger Scoring Chances | 16 |
| 10 | Odd-Man Rushes | 5 |
| 51.3 | Controlled Entry Success Rate | 53.8 |
| 32.4 | Puck Battle Win Percentage | 67.6 |
Let’s roll the tape on how the Sharks got better, and where they still have to get better.
Welcome to your new home for San Jose Sharks breaking news, analysis and opinion. Like us on Facebook, follow us on Twitter and don't forget to subscribe to SJHN+ for all of our members-only content from Sheng Peng and the National Hockey Now network plus an ad-free browsing experience.


Links20 hours ago
SJHN Daily: 6 More Possible Sharks Head Coach Candidates, Case for Don Granato

San Jose Sharks1 day ago
Zetterlund Going to World Championships, Talks Friendship With Eklund

San Jose Sharks1 day ago
Vlasic Doesn’t Think He’ll Get Bought Out (It Doesn’t Make Sense Anyway)

San Jose Sharks1 day ago
Thoughts on 10 Possible Sharks’ Head Coach Candidates

San Jose Sharks2 days ago
4 Things That Grier Might Be Looking for From Next Sharks Coach? (+)

San Jose Sharks3 weeks ago
NHL Scouts Talk Collin Graf’s Ceiling (+)

San Jose Sharks2 weeks ago
Don’t Expect Will Smith To Sign With Sharks This Season

San Jose Sharks1 week ago
Grier on State of Sharks’ Rebuild, Free Agency Plans, Empty Seats at SAP Center & More (+)

San Jose Sharks2 weeks ago
Sharks Locker Room: What’s the Organization’s Plan Besides Hoping To Draft Celebrini?

San Jose Sharks2 weeks ago
Penguins Miss Playoffs: Sharks Likely To Have Two 2024 Draft Lottery Picks
San Jose Sharks1 day ago
Zetterlund Going to World Championships, Talks Friendship With Eklund
San Jose Sharks1 day ago
Vlasic Doesn’t Think He’ll Get Bought Out (It Doesn’t Make Sense Anyway)

San Jose Barracuda4 days ago
REACTION: Quinn Fired!

San Jose Sharks6 days ago
Ferraro Teases Burns, Excited To Bring Sharks Back to Playoffs One Day

San Jose Sharks6 days ago
Granlund Will Play for Finland, Talks About Being ‘Dad’ for Eklund & Zetterlund
