San Jose Sharks
Inside the Sharks PK: Where Can They Be Beat?

There’s no such thing as a perfect penalty kill.
You’re down one man or two. Imagine a leaking boat — you plug one hole, another is bound to appear.
In part, that’s what makes the accomplishment of the 2019-20 San Jose Sharks penalty kill all the more impressive.
The NHL’s 29th-best team managed a league-best PK. Remarkably, this 28-spot difference between overall finish (29) and penalty kill rank (1) is the widest in NHL history.
So what made the San Jose Sharks PK tick?
SPORTLOGiQ’s data sheds new light on the finer points of San Jose’s penalty kill, what they don’t do well and what they do well.
Where the Sharks PK is lacking is actually telling — these are the key elements that they don’t emphasize on their way to success. This is Part 1 of a two-part series.
DZ Entry Denial %
San Jose is just 18th in the league with a 34.4 Short-handed (SH) Defensive Zone (DZ) Entry Denial %, compared to NHL-best Nashville (41.0) and the median (35.2).
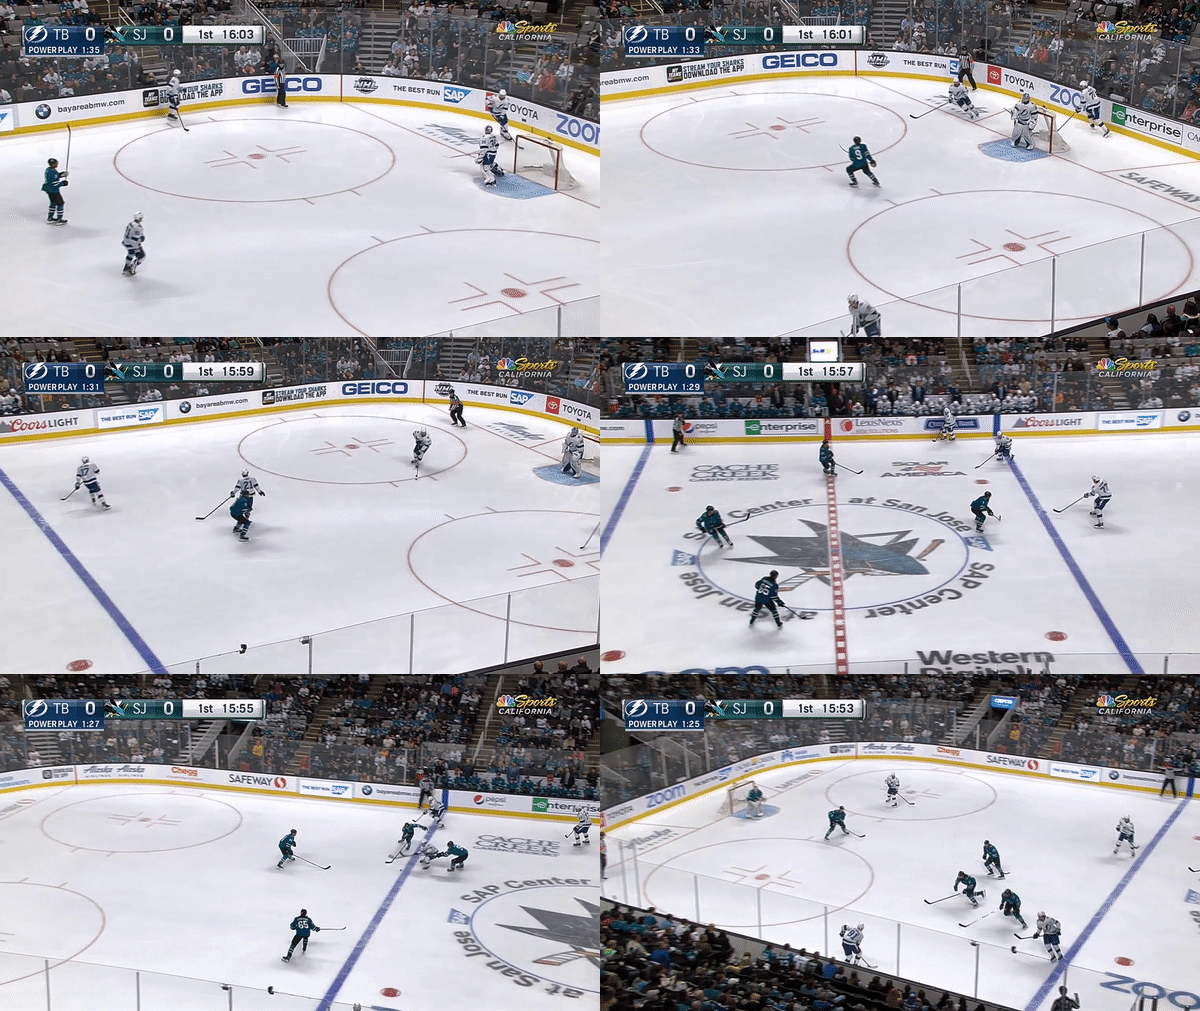
Essentially, they don’t focus as much on preventing the opposition from gaining the zone. This does seem to conform with how the Sharks forecheck on the PK — they don’t send a lot of pressure up the ice.

San Jose usually sends one forechecker — in this case, Evander Kane (9) — who sags off once the power play breakout has crossed the neutral zone. At that point, the Sharks typically go into a 1-2-1 which doesn’t emphasizes zone entry denials until the blueline.
Shot Attempts Blocked %
The Sharks blocked 23.9% of the opposition’s shot attempts on the penalty kill, just 27th in the league compared to NHL-best Washington (35.8) and the median (27.6).
Per Natural Stat Trick, they were also 27th last year and 19th from 2016-19.
Like denying zone entries, the San Jose PK isn’t trying to avoid shot blocks. We’re just talking about points of emphasis, or lack thereof.
There may also be a premium placed on allowing Martin Jones to see the shot clean.
Also, they’re trying to conserve energy for other penalty killing pressure points. We’ll get to that in Part 2 of this story.
Inner Slot Shots Against
San Jose allowed 0.53 Inner Slot Shots Against on the PK, 26th in the NHL compared to NHL-best Columbus (0.31) and the median (0.44).
Again, this fits with what they’ve done before — last year, they finished 26th in the league in SH High-danger Corsi Against Per 60 (HDCA/60). They were 27th from 2016-19.
This is interesting — one would think allowing so many chances in tight would be problematic.
In fact, the data supports that too: From 2016-19, seven of the top-10 squads in SH HDCA/60 were also top-10 PK teams. On the other hand, just two of the bottom-10 squads in SH HDCA/60 were top-10 PK teams (San Jose and Anaheim).
If this trend holds, it’s something to get to the bottom of next season.
So where do the San Jose Sharks excel on the penalty kill? What are their points of emphasis?
This will be detailed in Part 2, powered by SPORTLOGiQ!


