
 Sheng Peng
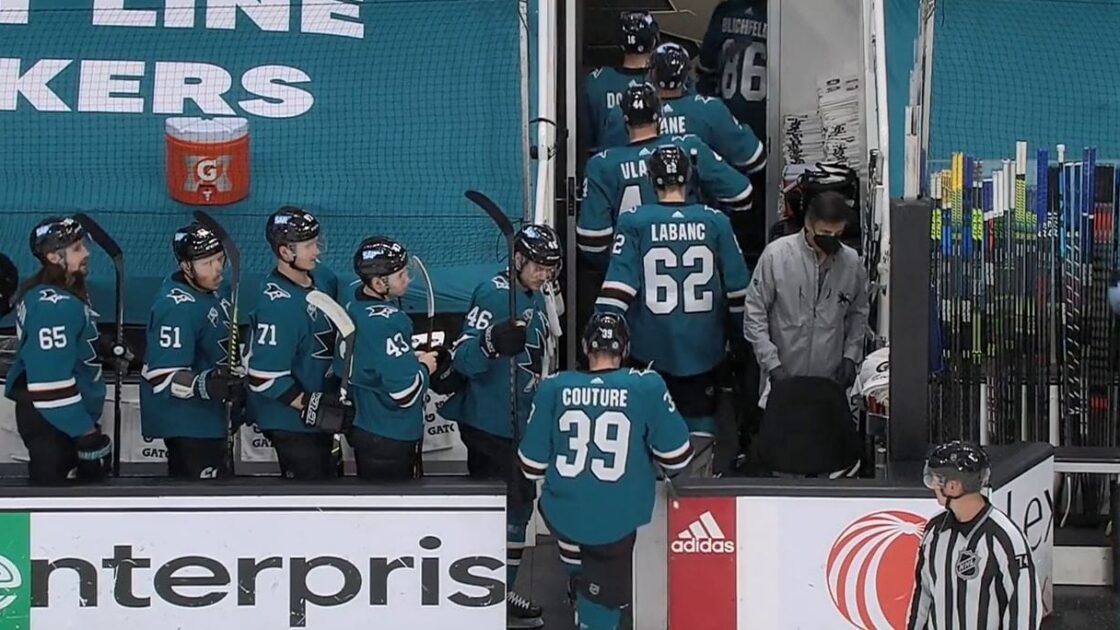
For the San Jose Sharks to come back to prominence this year, they needed Erik Karlsson and Brent Burns to return to dominance.
That hasn’t quite happened.
At the moment, Burns is on an 82-game pace for 47 points (13 goals, 34 assists). Karlsson is on an 82-game pace for 29 points (6 goals, 23 assists). That’s a far cry from their customary near point-per-game paces.
I know, points aren’t everything. And both Norris Trophy winners have shown genuine flashes of greatness – this is from Monday and Wednesday against the Kings.
Suffice to say, both blueliners are still capable of pulling off world-class plays – but it’s fair to ask, are they doing so on a regular enough basis to still be considered world-class players?
Points, of course, are just the output from multiple on-the-ice inputs.
Just past the halfway mark of the season, let’s dive into some of these inputs, the San Jose Sharks’ individual underlying numbers – perhaps they will help us figure out why Burns and Karlsson are producing less this season? We’ll also see underappreciated areas where Rudolfs Balcers, Logan Couture, and Ryan Donato, among other Sharks, are shining.
Forwards
Rudolfs Balcers
When you think Rudolfs Balcers, you think offense, so it might be surprising to see that he’s second among San Jose Sharks forwards with 3.88 Blocked Shots Per 60 at 5-on-5.
On the offensive side, he’s fourth among NHL forwards with 1.79 Rebounds Created Per 60 (of 399 forwards, 150+ 5-on-5 minutes). We’ll see if this is a sustainable skill for Balcers – for what it’s worth, he was second among Senators forwards in this category from 2018-20.
Logan Couture
Logan Couture currently sports a 50.4 Faceoff Win %, which isn’t remarkable, except he hasn’t won over 50 percent of his faceoffs in a season since 2013-14. From 2014-20, his Faceoff Win % is 45.2.
Couture leads the team with 11 goals at 5-on-5; he’s tied for second in the league in this category with Connor McDavid, Auston Matthews, Tyler Toffoli, and Joel Farabee, only behind Mikko Rantanen’s 14.
That’s especially impressive considering his deployment. His 37.68 Offensive Zone Faceoff % — meaning his ratio of OZ draws versus his ratio of Defensive Zone draws at 5-on-5 – is second-toughest among San Jose forwards. Just for comparison, here’s the OZ Faceoff % for the aforementioned cluster of top 5-on-5 goal scorers: Rantanen 66.37, McDavid 62.99, Matthews 58.47, Farabee 54.59 and Toffoli 59.09.
Ryan Donato
Ryan Donato leads San Jose with a +8 Net Penalty Differential. He also leads the team with 13 Penalties Drawn – that’s good work in limited ice time.
The winger also leads all Sharks forwards at 5-on-5 with 1.03 Rush Attempts Per 60 and 4.97 Individual High-Danger Corsi For Per 60.
Kurtis Gabriel
Kurtis Gabriel has played just 10 games. But small sample size or not, it’s clear that he’s one of a kind on San Jose in terms of physicality. His 31.36 Hits Per 60 is almost 17 Hits Per 60 more than any other Shark. He’s literally hitting anything that walks – for what it’s worth, Ryan Reaves leads the league with 24.16 Hits Per 60 (of 614 skaters, 150+ minutes at 5-on-5).
Dylan Gambrell
Dylan Gambrell is seventh in the NHL with 4.26 Blocked Shots Per 60 (of 399 forwards, 150+ minutes at 5-on-5).
He’s really fashioned himself into a defensive specialist – his 36.02 Offensive Zone Faceoff % is toughest among all San Jose Sharks forwards and he’s second with 2:10 Short-Handed Time on Ice Per Game.
Evander Kane
No surprise, Kane is the worst Sharks forward with a -7 Net Penalty Differential. To his credit, after 14 minor penalties in his first 13 games, he’s had just three minor penalties since Feb. 13 versus Vegas.
Perhaps related, Kane’s 6.14 Hits Per 60 at 5-on-5 is on pace for the second-lowest of his career, trailing only 2016-17’s 5.89. He’s averaged over eight Hits Per 60 since he’s been in San Jose. Is he passing up a hit here or there to avoid penalties?
Kevin Labanc
Kevin Labanc is putting together a solid campaign: His 2.57 Points Per 60 at 5-on-5 leads the team. Like Couture, he’s doing this despite a challenging Offensive Zone Faceoff % — his 40.78 is on pace for toughest of his career. He’s been otherwise over 50 percent in every season of his career.
Timo Meier
Timo Meier is shooting as much as ever – his 20.08 Individual Shot Attempts Per 60 at 5-on-5 is fourth in the NHL, behind Brendan Gallagher, David Pastrnak, and Alex Ovechkin. Interestingly, however, his 3.78 Individual High-Danger Corsi For Per 60 at 5-on-5 is a sharp drop from his customary number – from 2017-20, he averaged 5.59 iHDCF. Does Meier need to take the puck to the net more?
Matt Nieto
Matt Nieto is tied with Donato for the San Jose lead with 4.97 iHDCF Per 60.
He’s also the most-used forward on the PK, averaged 2:47 SH TOI Per Game.
Defensemen
Brent Burns
When Bob Boughner was hired by the San Jose Sharks last December, he said about Brent Burns, “In this new offensive thing that we have, he’s maybe not going to get as many shots.”
That didn’t fully manifest itself last year, but it certainly has this season. Burns is averaging just 4.54 Shots Per 60 at 5-on-5 – from 2015-19, he averaged 9 Shots Per 60.
So is Burns’s reduced production a product of a system that discourages point shots and encourages offense from below the tops of the circles? Naturally, Burns is going to shoot less if he’s looking to fire from closer in – the opposition will be able to challenge him more.
Boughner offered this week: “We have been better at generating offense from the backend, D jumping up as the fourth man up the ice. You can see in our game, sometimes there’s a defenseman below the goal line. We want them to be active in the D zone, and maybe that takes away a little bit from that low to high big shot.”
But the bench boss still wants Burns to blast away: “Burnzie is a little bit of a different animal, obviously. With that shot, we want shot volume out of him. He still has opportunity to shoot the puck during the game. Getting it through for him is the big thing because it’s a rocket. Definitely with him, it’s a little bit of a different set of rules.”
There’s a delicate balance here that perhaps hasn’t been struck: The San Jose Sharks aren’t going back to the days of DeBoer, where their offense orbited Burns’s one-of-a-kind ability to uncork his shot from literally anywhere on the blueline. But maybe Burns still hasn’t quite found his way with the new Sharks.
Will he? Or is this the new normal for the 36-year-old?
Mario Ferraro
Mario Ferraro is tied with Burns for the San Jose lead with 2:54 SH TOI Per Game.
Interestingly, he’s absorbing less punishment this year despite an elevated role against better competition. His 5.93 Hits Taken Per 60 at 5-on-5, down from 9.02 in his rookie year is a significant drop. Is this a mark of a more mature defenseman?
Erik Karlsson
Burns’s production, though reduced, at least resembles his salad days. His 1.11 Points Per 60 at 5-on-5 isn’t too far from 2015-19’s 1.49.
Erik Karlsson, however, is far short. His 0.5 Points Per 60 at 5-on-5 is a shadow of his league-leading 1.44 from 2011-20.
For more context, from 2011-20, only six defensemen averaged 0.5 or less Points Per Game at 5-on-5, while accumulating 5,000+ 5-on-5 minutes: Mark Fayne, Jon Merrill, Rob Scuderi, Adam McQuaid, Erik Gudbranson, and Nick Schultz.
Two years into Karlsson’s eight-year contract, I don’t think this is the company that Doug Wilson envisioned his big investment keeping.
By the way, this 5-on-5 lack of production is a season-long thing. Since Karlsson’s return from a groin injury on Feb. 27 – and he’s honestly looked better – he’s averaged 0.46 Points Per Game at 5-on-5.
Karlsson’s underlying numbers don’t betray an obvious reason for this: He can stand to shoot more, his 4.12 Shots Per 60 at 5-on-5 is off his 6.25 pace from 2017-20. His OZ Faceoff %, which started out tough, has been softened since his return: His 54.49 is easiest among Sharks defensemen.
I might have to dig into the micro-stats to tease out more revealing answers.
Obviously, we don’t want to make too big a deal about points, but Karlsson’s lack of production bears investigating.
Nikolai Knyzhov
Nikolai Knyzhov has a league-worst -13 Net Penalty Differential. In fairness, the rookie is playing up – he might be better suited for bottom-pairing minutes right now – but he’ll need to stop the parade to the penalty box to live up to his potential.
Radim Simek
Quietly, Radim Simek has been doing a lot of the dirty work on the San Jose Sharks blueline. He leads the team’s defense and is 17th in the NHL with 8.76 Hits Per 60 and 27th with 5.14 Shots Blocked Per 60 (of 215 defensemen, 150+ minutes at 5-on-5). These are on pace for career highs.
Marc-Edouard Vlasic
The micro-stats – along with Boughner’s dropping him to bottom-pairing – have already offered clear indicators of where Marc-Edouard Vlasic’s game is at.
In fairness to Vlasic, his OZ Faceoff % at 5-on-5 is brutal: His 34.24 is seventh-toughest in the NHL, far more difficult than his customary 40 percent or higher. Essentially, he’s getting all the DZ faceoffs without any OZ ones to make him look better.
Goaltending
What can be said about goaltending that continues, as a whole, to struggle? It’s worth noting, however, that Martin Jones’s recent hot spurt has moved his Goals Saved Above Expected past Devan Dubnyk’s. His -5.41 is 26th in the NHL; Dubnyk’s -8.48 is 32nd (of 39 goalies, 500+ minutes).
Stats up to 3/24/21 from Evolving Hockey, Hockey Reference, Natural Stat Trick, and NHL.com.