
 Sheng Peng

There’s reason to believe that Erik Karlsson can bounce back offensively next year.
Yesterday, with the help of SPORTLOGiQ, I highlighted a number of key areas where Karlsson was as dangerous as ever this season.
In short, there’s good evidence that Karlsson had an underlying offensive impact similar to recent years — he just didn’t enjoy the results this time around.
It could be an outlier, a one-year thing. Karlsson registered 0.42 Points Per Game in 2020-21, the worst of his career. From 2011-20, his lowest mark in a season was 0.71 PPG.
That said, you can’t look at the bright side with everything Karlsson-related last year.
There’s plenty to worry about with Karlsson: According to SPORTLOGiQ, this is where the San Jose Sharks should be most concerned.
OZ Pass Completion Rate
So not everything is peachy keen about Karlsson’s underlying offensive numbers. The 31-year-old blueliner is considered one of the finest playmakers of his generation, complete with a feathery touch on the pass and 360 vision.
But what if a great passer…can’t pass?
| OZ Pass Completion Rate (5v5 Per 20) | 2017-18 | 2018-19 | 2019-20 | 2020-21 |
|---|---|---|---|---|
| Erik Karlsson | 62.2% | 64.0% | 67.4% | 57.7% |
At first glance, that doesn’t seem like a huge difference — Karlsson is connecting on about 5-10 less offensive zone passes per 100 than we’re used to — but it adds up, a lot of potential offense that Karlsson is leaving on the table.
For what it’s worth, this malady is not affecting Karlsson in the defensive zone: Here’s his DZ Pass Completion Rate over the same time period.
| DZ Pass Completion Rate (5v5 Per 20) | 2017-18 | 2018-19 | 2019-20 | 2020-21 |
|---|---|---|---|---|
| Erik Karlsson | 68.8% | 71.2% | 69.7% | 71.8% |
So it’s not like Karlsson simply forgot how to complete a pass all over the ice — just in possibly the most important area of the ice.
| Slot Pass Completion Rate (5v5 Per 20) | 2017-18 | 2018-19 | 2019-20 | 2020-21 |
|---|---|---|---|---|
| Erik Karlsson | 46.2% | 48.9% | 55.7% | 41.9% |
Here’s an example of Karlsson creating offense out of thin air, but missing the pass in the slot.
In fairness, that’s not an easy connection for Karlsson (65) to make to Patrick Marleau (12), but it’s a good example of doing everything right up to that final feed.
By and large though, as yesterday’s deep dive indicated, there’s still a lot to like about Karlsson on the offensive end. Connect on a few more slot passes, notch a few more assists, and maybe Karlsson’s production begins to resemble what’s expected.
No, the big worry about Karlsson is on the defensive end. We could see it in how San Jose Sharks head coach Bob Boughner deployed him: As the season progressed, he tapered off Karlsson’s Defensive Zone Faceoffs and Penalty-Killing Usage.
| Player (5v5) | 2020-21 | OZF% | DZF% | 2020-21 | OZF% | DZF% |
|---|---|---|---|---|---|---|
| Brent Burns | 1/13-2/26 | 25.68 | 34.14 | 2/27-5/19 | 25 | 36.95 |
| Erik Karlsson | 1/13-2/26 | 28.21 | 37.95 | 2/27-5/19 | 35.63 | 31.29 |
| Marc-Edouard Vlasic | 1/13-2/26 | 18.58 | 44.27 | 2/27-5/19 | 28.8 | 37.7 |
| Mario Ferraro | 1/13-2/26 | 26.06 | 33.55 | 2/27-5/19 | 23.17 | 37.67 |
| Nikolai Knyzhov | 1/13-2/26 | 28.42 | 37.37 | 2/27-5/19 | 33.12 | 31.66 |
| Radim Simek | 1/13-2/26 | 32.73 | 30.91 | 2/27-5/19 | 31.8 | 35.74 |
As for the PK, Karlsson went from averaging a team-leading 2:51 a night before hitting the DL with a groin injury — to 00:39 a game after his Feb. 27 return.
Essentially, Karlsson went from Boughner’s most relied-upon 5-on-5 Defensive Zone Faceoff and penalty-killing defenseman — to his least relied-upon. Essentially, from Feb. 27 on, Karlsson became a primarily one-way blueliner.
This wasn’t always the case, by the way: Karlsson was a better defender earlier in his career.
Yesterday, we noted that Karlsson was still very active with zone exits — getting the puck out with possession. That’s the good news defensively with him. But pretty much everything else appears to be a concern.
My perception is that opposing attackers are going after Karlsson with more frequency. Essentially, they’re targeting him.
These micro-stats support (not conclusively) the hypothesis: Karlsson is allowing markedly more controlled entries and forcing less dump-ins at 5-on-5 than in 2017-18, his last season in Ottawa. And if SPORTLOGiQ is tracking it, opposing teams are seeing it.
Entries Against
| Entries Against (5v5 Per 20) | 2017-18 | 2018-19 | 2019-20 | 2020-21 |
|---|---|---|---|---|
| Erik Karlsson | 5.81 | 5.45 | 5.93 | 6.35 |
Dump-ins Against
| Dump-ins Against (5v5 Per 20) | 2017-18 | 2018-19 | 2019-20 | 2020-21 |
|---|---|---|---|---|
| Erik Karlsson | 6.78 | 4 | 4.41 | 4.81 |
All this is reflected in Karlsson’s deteriorating ability to deny zone entries.
DZ Denial Rate
| DZ Denial Rate (5v5 Per 20) | 2017-18 | 2018-19 | 2019-20 | 2020-21 |
|---|---|---|---|---|
| Erik Karlsson | 50.2% | 44.2% | 44.1% | 43.5% |
In the last article, I talked about Karlsson’s straight-ahead speed, and how that appears mostly intact, hence his consistency with End-to-End Rushes and Zone Entries even in 2020-21. But as ex-Toronto Marlies assistant coach Jack Han delineated both in his Hockey Tactics Newsletter and San Jose Hockey Now, Karlsson’s defensive skating — his agility and comfort accepting the rush — remains an ongoing liability.
This was all too familiar a sight this year.
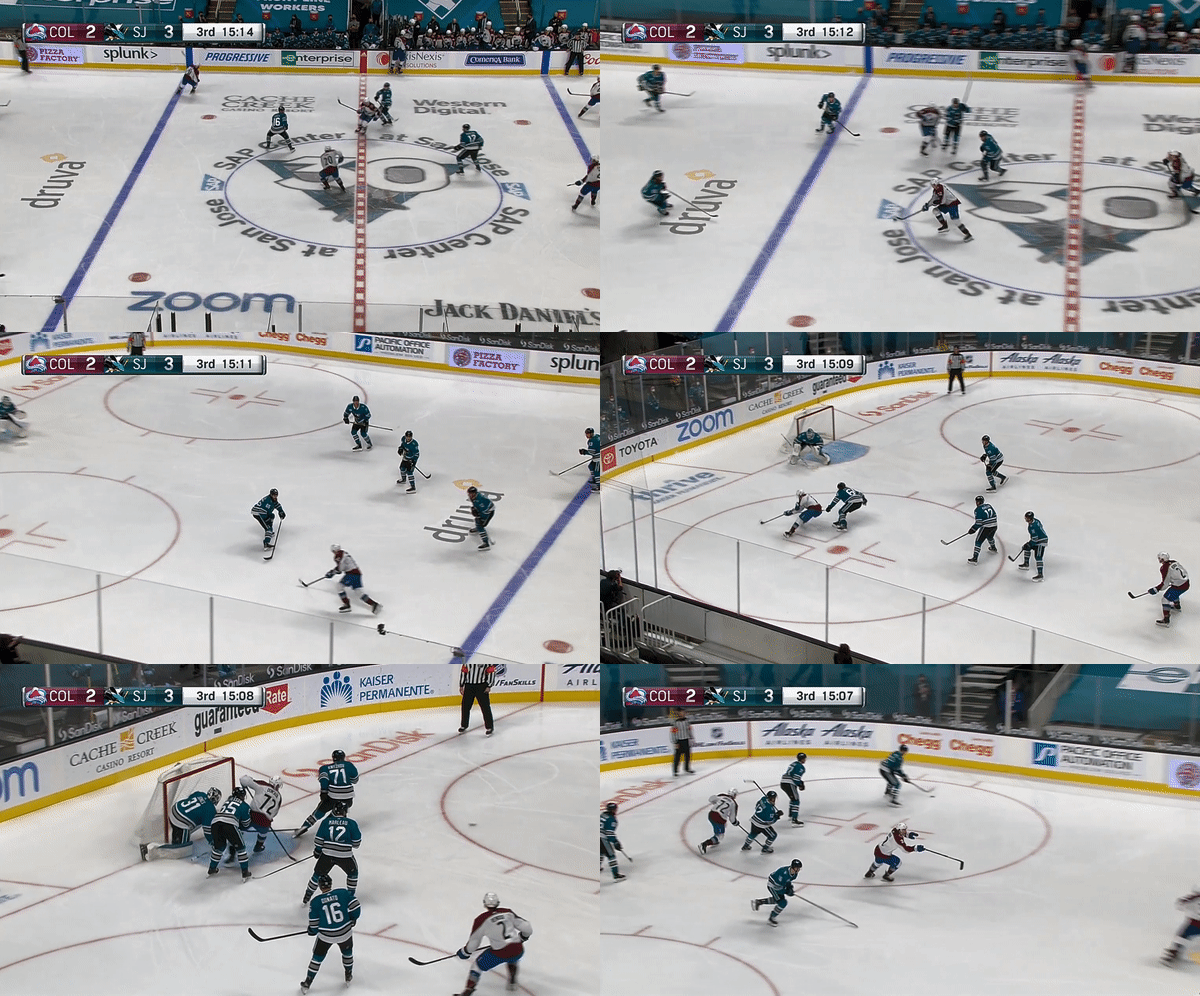
In short, attackers can beat Karlsson to the outside with impunity. But that’s been the case for a while.
What’s even more disturbing?
As Han noted, Karlsson has been a poor defensive skater from the beginning of his career. But he was able to mitigate that weakness with a flurry of activity in the defensive zone: In 2017-18, Karlsson ranked third among all NHL defensemen in Total Defensive Plays (Blocked Shots, Stick Checks, Blocked Passes).
That’s not the case anymore.
Blocked Passes
| Blocked Passes (5v5 Per 20) | 2017-18 | 2018-19 | 2019-20 | 2020-21 |
|---|---|---|---|---|
| Erik Karlsson | 6.59 | 6.56 | 4.77 | 5.42 |
Stick Checks
| Stick Checks (5v5 Per 20) | 2017-18 | 2018-19 | 2019-20 | 2020-21 |
|---|---|---|---|---|
| Erik Karlsson | 2.01 | 1.96 | 1.55 | 1.16 |
Karlsson’s defensive motor doesn’t appear to be revving like it used to. Be it because of age, injury, conditioning, or a lack of motivation, this might be the most disturbing trend I’ve seen — the trend most unlike the old Karlsson, who I always thought an underrated defender.
Underscoring this disparity in offense and defense, compare Karlsson’s OZ Loose Puck Recoveries versus Dump-in Recoveries stats.
| OZ Loose Puck Recoveries (5v5 Per 20) | 2017-18 | 2018-19 | 2019-20 | 2020-21 |
|---|---|---|---|---|
| Erik Karlsson | 4.73 | 4.62 | 4.06 | 4.39 |
| Dump-in Recoveries (5v5 Per 20) | 2017-18 | 2018-19 | 2019-20 | 2020-21 |
|---|---|---|---|---|
| Erik Karlsson | 6.8 | 6.37 | 6.5 | 5.13 |
The energy appears to be there offensively, less so defensively.
Most likely? I think Karlsson is conserving his energy for offensive bursts — he’s 31, not 21 — but that’s not a No. 1, 25-plus minutes a night defenseman anymore. Boughner’s deployment, again, tells a story: Before Feb. 27, Karlsson averaged 25:36 a night. From Feb. 27 on, he played 22:55 a game.
That’s still a very useful player, by the way — Karlsson is probably still a world-class offensive player.
He’s gone from great offensively and good defensively to good-maybe-great offensively — and below-average defensively.
The problem: That’s not highest-paid defensemen in the world territory.
But the only thing I can say to that is get over it. He’s here in San Jose for six more years — there’s not a lot you can do about it. Karlsson may not be Karlsson anymore, but like say Shea Weber in Montreal, he can still be a good player on a good team, who just happens to be making more than he should.
So for Karlsson and the San Jose Sharks, it’s about figuring out how they can mitigate his growing number of weaknesses, so his still elite strengths can shine.
Can they do that? They have no choice.